One of Solarian’s new scopes of work is to regularly perform employer auditing services on behalf of the investor at operating power plants. In this context, it is in contact with the O&M contractor and ensures the follow-up and reporting of processes such as whether the contract terms are complied with, whether there is an interruption in the power plants. In a way, it takes the operational burden of SPPs from the investor.
As such, there is a need to calculate a metric that will clarify the issues between the investor and the O&M service provider. As you all guessed, this metric is the PR ratio calculation. So how should this PR ratio be calculated correctly? How successful is the PR ratio in the operation of a facility? Is the PR rate sufficient for everyday use?
The PR ratio is simply the ratio of actual production to calculated (expected) production.
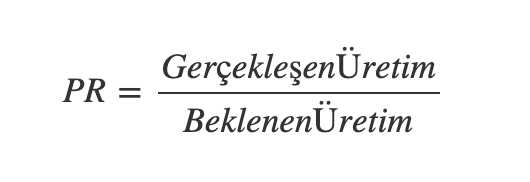
Actual production is the value we should get from the OSOS counter. So how should “Expected Production” be calculated? It is better understood if I show the calculation on the PVSYST example.
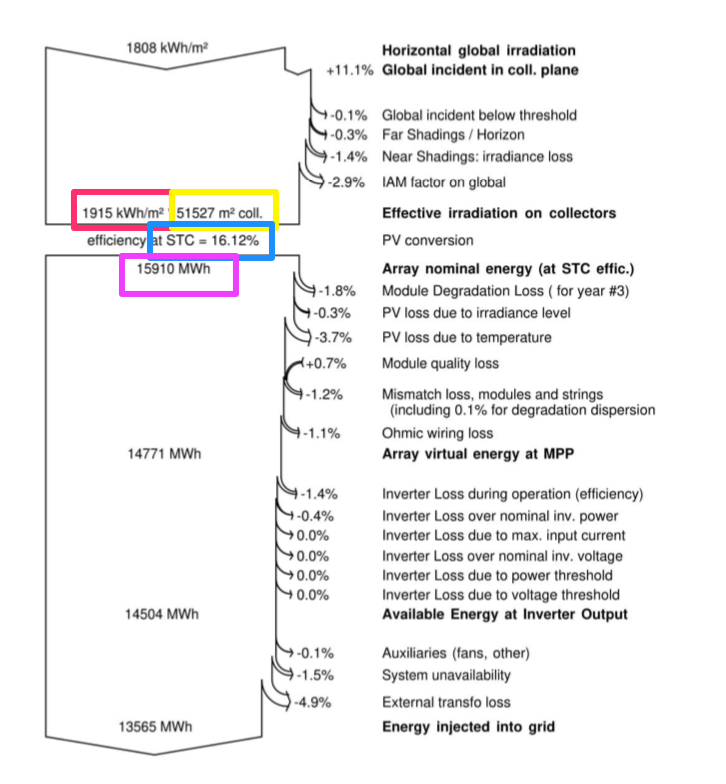
The part I have marked in red here is the measurement value we get from the pyranometer or reference cell. It means that we aim for 1.915 kWh/m² of radiation in a year. 51.527m² is our panel surface exposed to sunlight. Based on the fact that our solar panel is produced with 16.12% efficiency, we find that we have an installed DC power of 51.527m² * 16.12% = 8.306kWp.
1.915 kWh/m² * 51.527m² * 16,12% = 1.915 kWh/m² * 8.306kWp = 15.910MWh expected production. If we put this into our formula

The PR ratios we will obtain as a result of this calculation will change according to the months due to temperature and according to the years due to degradation. If we calculate the yearly PR distribution for the PVSYST operation that I shared the example above, we will see a graph like below (In the PVSYST production report above, temperature and degradation are taken into account. In the graph below, he did not participate).
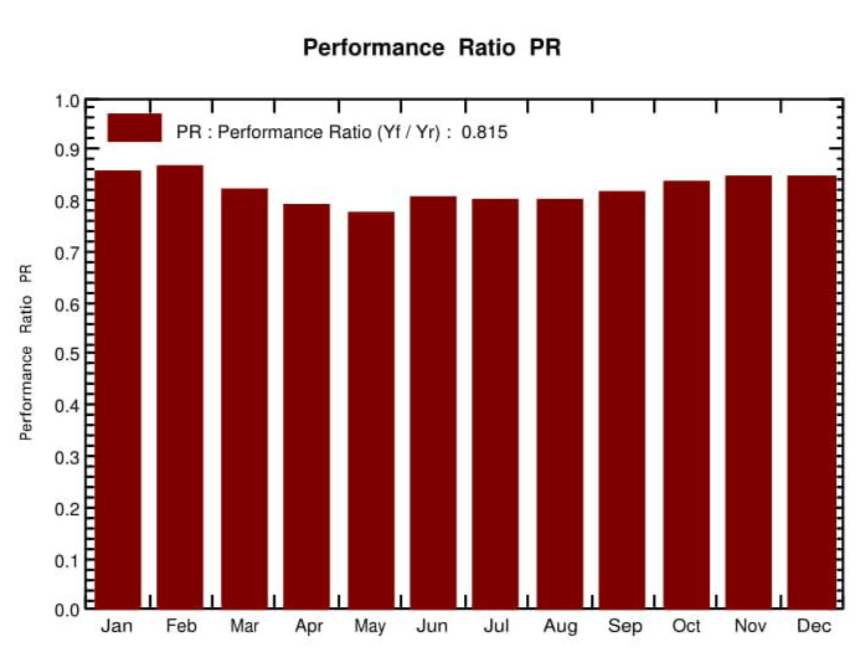
The value that PVSYST gives us for this study is 81.5%. So why are we not in the 100%-95% band? First of all, there are some calculated losses within the system itself. In the PVSYST report, when you look at the route from 15,910MWh to 13,565MWh, you will see that there are losses within the system itself.
In IEC 61724-1, the PR calculation is calculated as follows, taking into account the temperature.
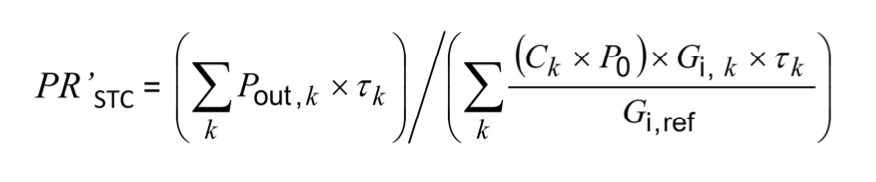
You didn’t understand anything, did you? 🙂 Don’t worry, the number of people who understand is very few 🙂 In summary, in the calculation I gave above, DC calculates the installed power by revising it again with the average temperature in each unit calculation period (hourly, monthly, yearly, etc.). The goal here is to get rid of the PR value that changes every month and to reach a constant value in all months, thus making it easier to track.
But is PR really the right metric to monitor a facility? Let’s share a screen from the PR calculation page of a Turkish monitoring company. This company’s PR calculation model works as follows.
![]()
Let’s look at a PR calculation based on this calculation
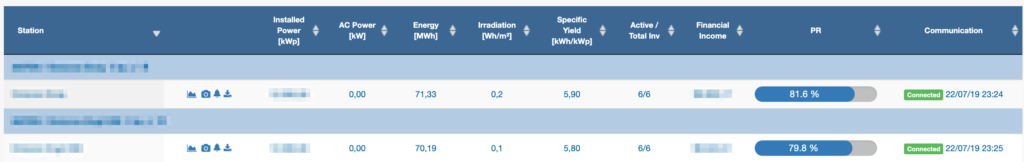
Here, two plants are in the same place and have the same power. Even the whole design is the same. No shading, no land slope. So why are the PRs different? Many factors can affect this figure, such as temperature, wind, quality of the panels, etc.
But there is another issue to be considered here, and a very important one. People perceive that this band is normal when they see a value in the 75%-85% band and after a while, if the PR value is not close to 50%, they think that the plant is working properly.
That’s why I’ve never really believed that PR is a quality metric – easy to write into a contract, but ineffective for site management. How?
Let’s say there are 20 inverters in our facility. Let’s assume that one inverter is disabled; the effect on PR will be x(1/20). For example, if we disable one inverter for the facility with 81.6% PR above, 81.6% * (1-1/20) = 77.5%. Look, the number is very close to the PR of the other facility.
Now let’s modify the graph above so that an inverter is disabled.
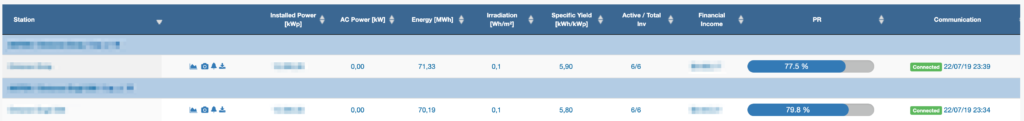
What would you think? For example, when I first saw them, they were both in the 77-79% range and I thought there must be no problem. For many people who watch their facilities in this way, PR is a calculation freak that makes no sense to me.
As Solarian, we definitely do not hide behind PR in the facilities we monitor and manage. In the analytical infrastructure we have developed, many variables from DC input arms of the plants to inverter parameters are monitored and reported live. Thus, a real plant efficiency can be observed. If you want to manage your facility in a healthy way, don’t get stuck on PR figures. Let our team and infrastructure take over that task for you.
Email : bilgi@solarian.com.tr