• Skip to primary navigation
  • Skip to main content

SOLARIAN

Are you ready to discover?

  • About Us
  • Services
    • Due Diligence
    • Inspection & Certification
    • Project Management
    • Investment Consultancy
  • Career
  • Contact Us
  • English
    • Türkçe
    • English
    • Deutsch
    • Română
    • Español
    • Italiano

Genel

Buying Solar Panels Online

Our experience in solar panel production/inspection has exceeded 10 years this year. From the production of components used in solar panels to the degradation of solar panels, 10 years full of analysis and studies.

One of the consultancy works we currently carry out is the inspection of the solar panel factory during the production phase. There are many issues we pay attention to, from the dot-comma in the certification documents to the psychology of the laminator operator, which is the only way to ensure proper production in some manufacturers.

(Note: Of course, there are factories that produce very good products without being inspected; I exempt them).

What about those who buy solar panels online for their small off-grid system, for their boat, for their hobby project? What are they really buying? I was curious; I went and bought them.

Betül Halil

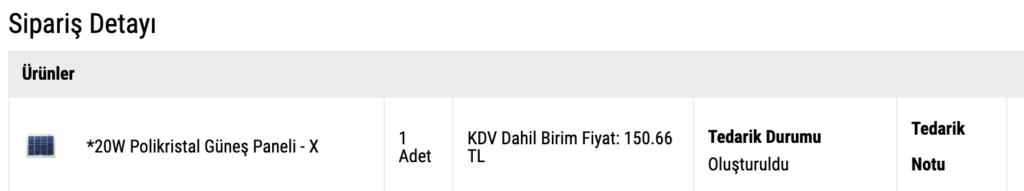
That’s the explanation. 20W solar panel; poly crystalline. After placing the order, I started to wait with great excitement; I wondered what would come?

By the way; 150,66TL including VAT. It comes to approximately 127TL. That corresponds to 18,26USD. If we say /20, I pay 0.92USD/Wp, which is around 0.25USD/Wp for solar panels today.

Anyway, time passed, after struggling with the carriers, I received the cargo in these COVID days.

Our first topic is visual inspection

Fractures in the cells. There is slippage in the arrays.
They must have hand-cracked the cells.
Soldering is more homogeneous than I expected
That’s the Junction Box. It has a lid like a battery box that you slide shut. IP68? What the hell is that?

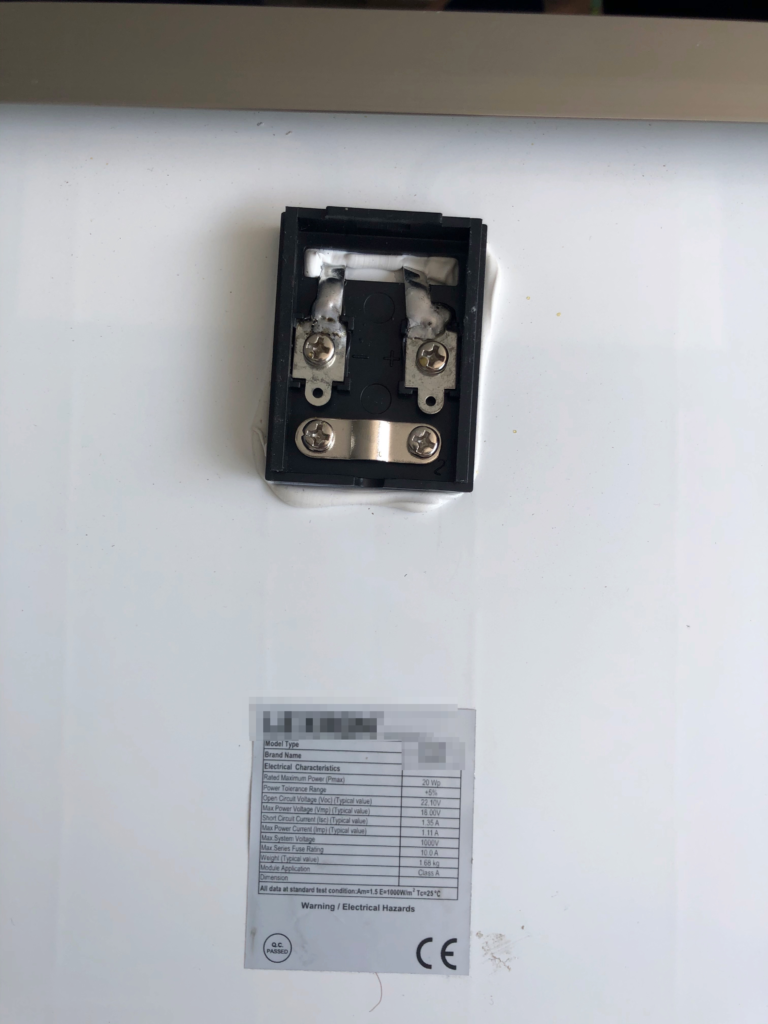
Visually, it’s bad. So how many watts is this panel that I bought as 20W?

I immediately set up the test rig on the roof of the office.

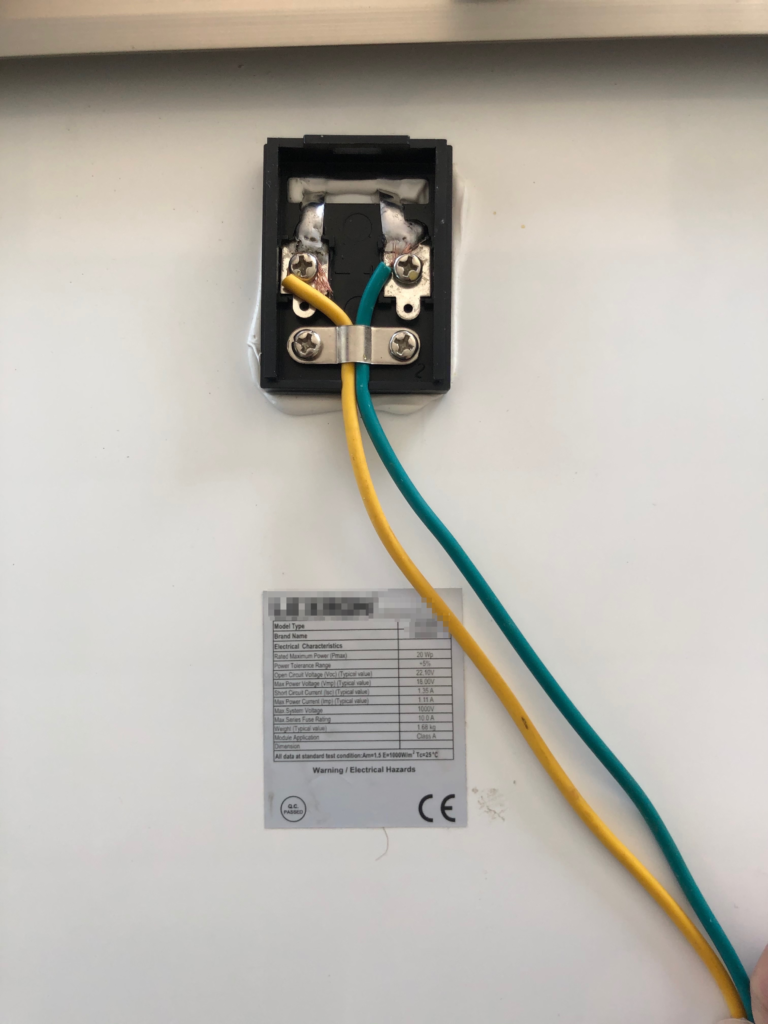
First I connect the cables. It doesn’t come with a cable.

Then I set up the test rig on our roof and reach through the window and place the test rig on the sloping ground next to us.

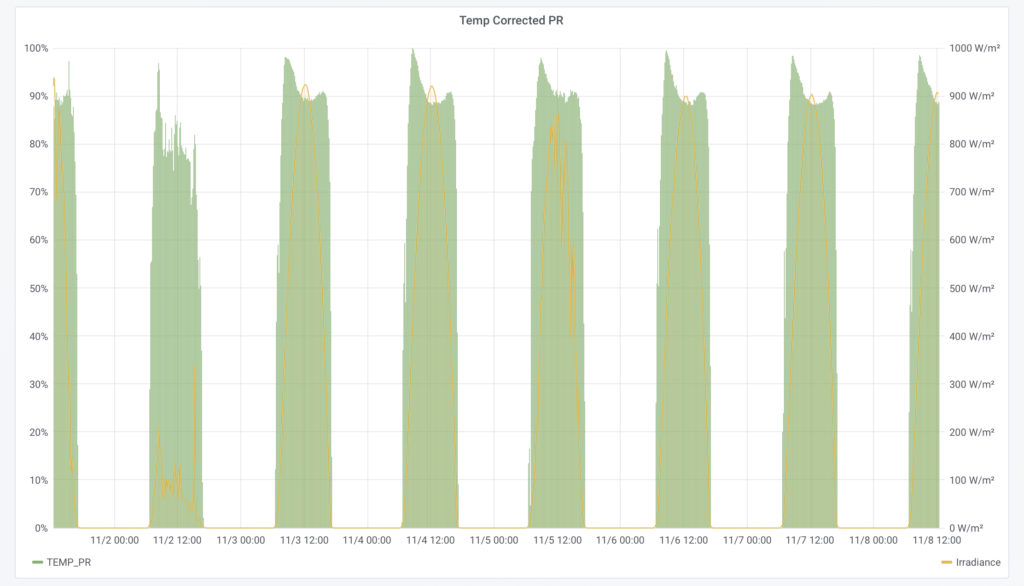
Our panel is ready for testing. I immediately perform IV measurements. I have a radiation of 966 w/m2. The ambient temperature is around 25 degrees. OPC conditions are very close to STC.

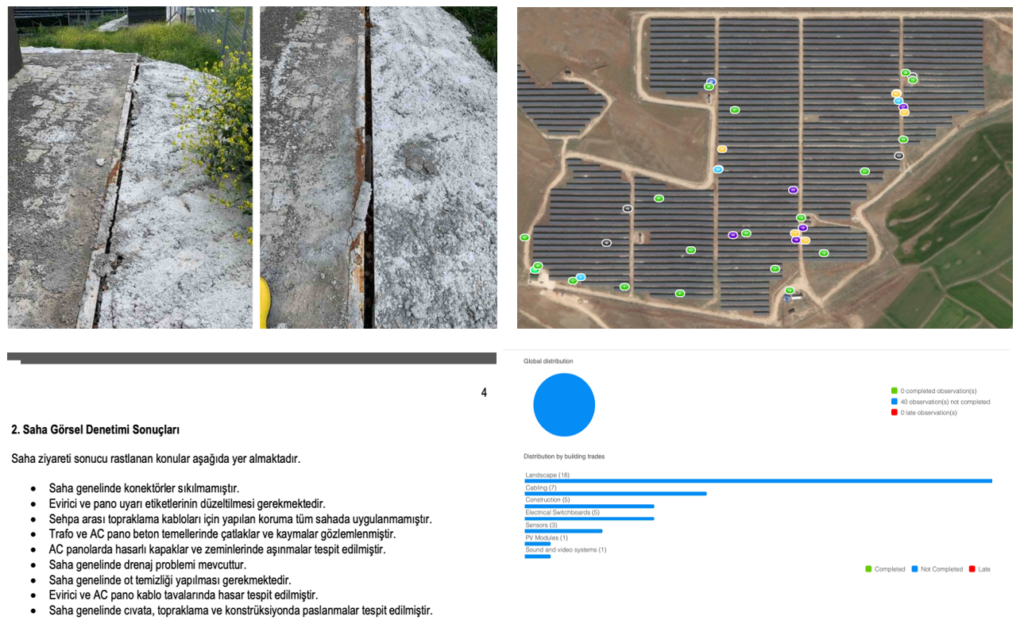
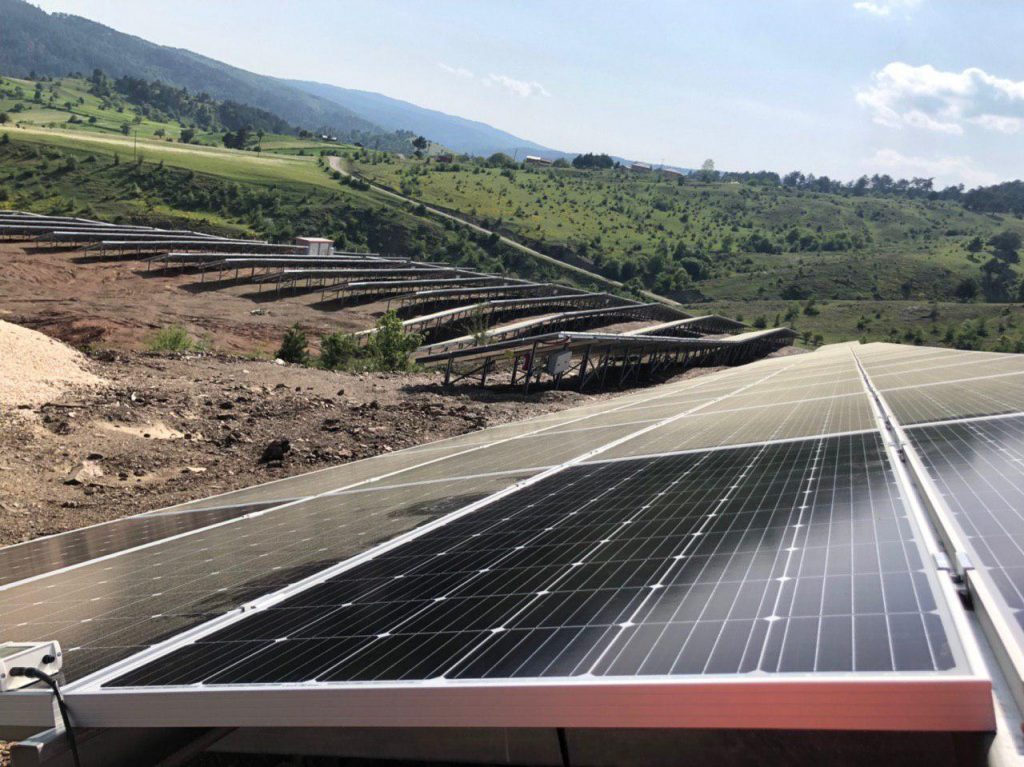
Before moving on to the IV measurement results, let me share a photo of a situation we encountered in a place where we went for inspection.

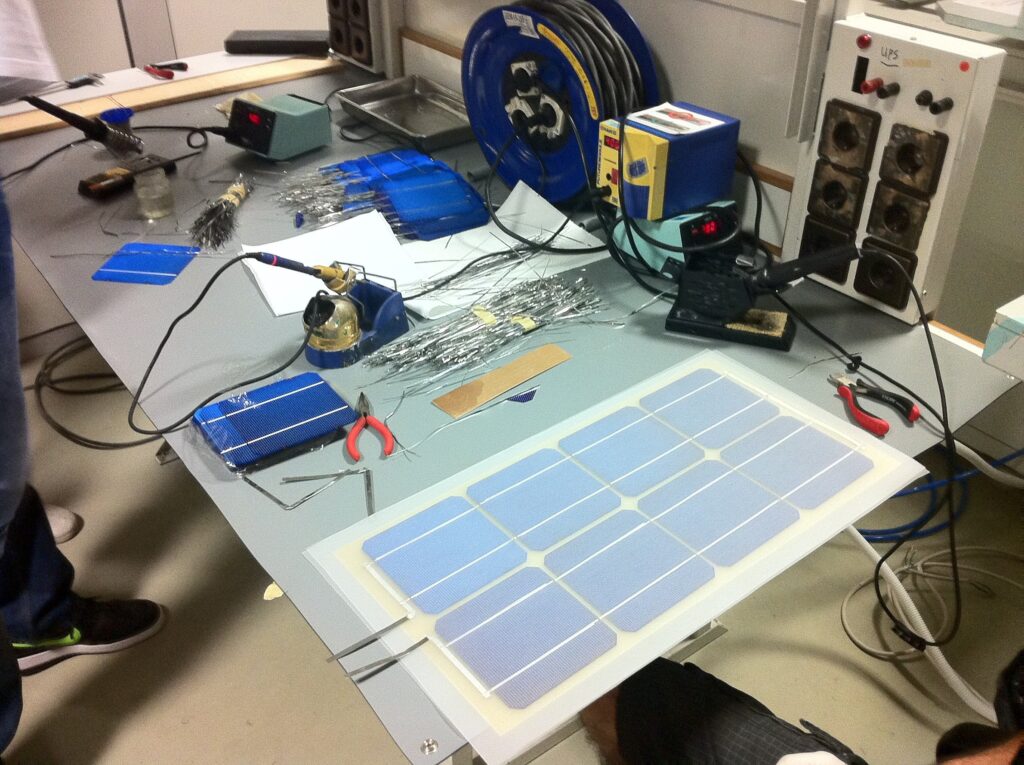
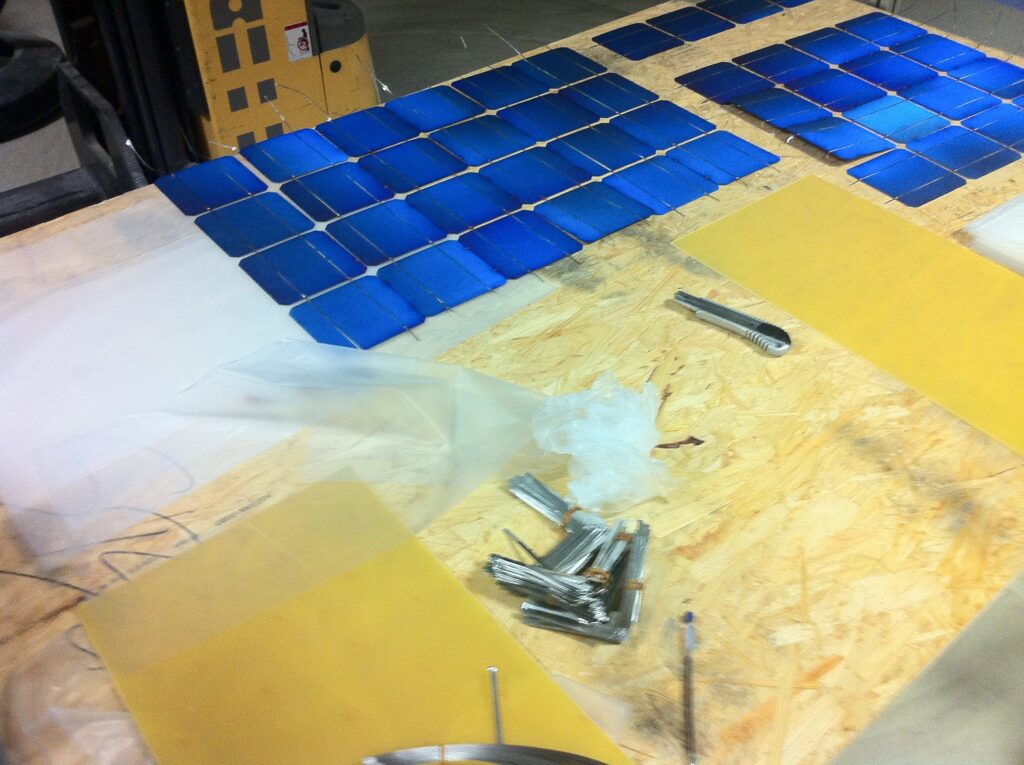
You may think that your product is made on German-made stringers and laminators, but sometimes this is not the case at all. Sometimes they solder cells with a soldering iron on the table.

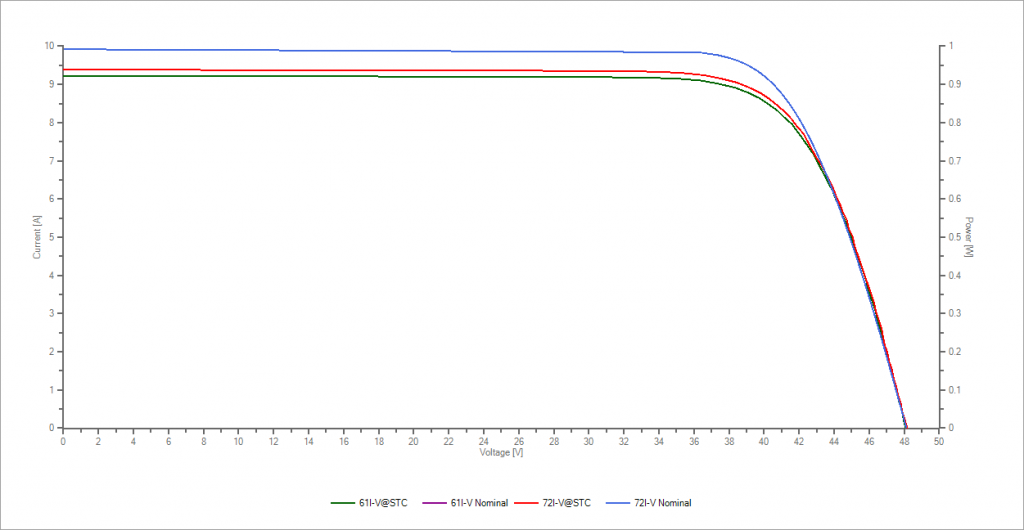
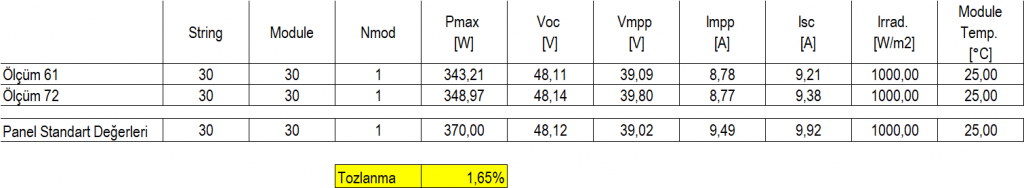
Anyway, let’s get to the IV test 🙂

I have measured the solar panel 4-5 times in a row, each time around 16W. This is the OPC measurement value. When I convert it to STC, it corresponds to around 16.4W. In other words, our panel is actually not 20W, and I would be very surprised if it was 20W.

But how good are the cells? Let’s do a quick EL test in the office.

Fractures, areas that do not pass enough current, etc. Considering that this product will quickly enter LID degradation, it will drop to 12W levels soon after you start using it.

I couldn’t do a thermal test because I need to pass current through it in order to do a thermal test and I don’t plan to use this panel as a generator.

To summarize; if you buy a panel online, you may not find what you expect.

If you have any questions about your solar panel, you can contact us below.

Email : [email protected]

Pyranometer or Reference Cell? Is expensive always good?

When we want to forecast production or calculate PR, the first question we ask when we are presented with data is the source of that data. Did you take it from the pyranometer or from the reference cell?

They both measure radiation. Only one is more sensitive and more expensive. Then he’s good, right?

Not 🙂

Pyranometer:

Pyranometers measure radiation by measuring the change in temperature difference between the black surface and the surface below it. In other words, the measurement point is the temperature measurement. The temperature change is also converted into radiation.

Reference Cell:

Reference cells are small solar panels. Like other solar panels, they start producing energy when they see light. We measure the radiation by measuring the short-circuit current of the reference cell.

So what are the differences between the two?

First of all, the light spectra they measure are different.

As you can see in the graph above, the spectrum of the light blue colored pyranometer is much wider than the spectrum of the photovoltaic cells shown in pink. The measurement range is therefore very wide.

Pyranometers, unlike reference cells, measure temperature, so the transmittance of the glass has no effect (and their effect on shape is minimal). However, since flat glass is used in reference cells, the reflection of light on the glass surface varies for each different angle and is therefore subject to IAM (Incidence Angle Modifier).

In terms of uncertainty, pyranometers are much better, but the reaction time of reference cells is faster.

So which product should be used to calculate PR correctly? Reference cells. ‘How?’ I hear you say.

Reference cells give similar reactions when silicon-based solar panels are used. Therefore, any variation in the facility can be easily determined. In addition, since the technology used is the same, the uncertainty will be lower (the response of the pyranometers to diffuse may not be the same as the response of the reference cells). The conversion of pyranometers placed horizontally on the plane into energy that can be used by solar panels will lead to mathematical operations. These mathematical operations will also increase the uncertainty. Our aim is to minimize measurement uncertainties.

At this stage, pyranometers stand out; comparison with the irradiance value calculated before the start of the investment. The irradiance databases that we rely on before starting the investment are measurements that include the entire spectrum. To calculate the deviation from these measurements, a pyranometer must be used in the horizontal plane. By comparing the assumed irradiance with the actual irradiance, the deviation in the model can be determined and the expected/actualized production analysis can be done more accurately by correlating the energy output with the reference cell (‘Why doesn’t this one produce this?’ syndrome). At this stage, it is not known how many companies working in detail like us can really calculate and compare in this detail.

When it comes to calculating the PR of the facility, the reference cell will give more accurate results. So, is only one reference cell sufficient? We recommend one reference cell for each transformer station. Data loss and calibration drift between reference cells can be a problem in later years.

An accurate PR calculation can be realized by compiling all this data in a healthy way.

Note: Even if you make an accurate measurement, if you use a monitoring/scada system that cannot take healthy measurements, every detail described above loses its meaning. There is no saving from the data monitoring system. Take care to work with proper companies.

Performance Management Scope

Our aim with performance management in solar power plants is to ensure that the plants in operation are operated in the best way and losses are converted into gains.

First, we conduct regular site visits to examine the defects on the site and transfer them to the relevant persons (investor and/or O&M company). As a result of the visits, rather than making a general comment about the site, we identify the defects and create our roadmap to extend the life of the power plant.

We perform weekly reporting of the power plants. This report allows you to see detailed information about the entire portfolio on a single page. While the report is open for improvement, it includes production and irradiance comparisons with last year, revenue, errors and details, comparison of power plants with each other and Solarian comments.

We ensure the control of the reports prepared by O&M companies. This control includes both the verification of calculations and the compliance of field activities with the contract.

We evaluate the performance and availability rates of power plants with monthly reporting. At the same time, we analyze data losses by comparing monitoring system data with OSOS data and create a solution map. In this report, we include the details of all site visits made during the month and all errors received about the power plant, the to-do list and the action plan for the next month.

We associate production data with hourly irradiance data and perform PR validation. Thanks to PR validation, we can easily determine the impact of degradation in solar panels on production and we verify this study with our IV measurements in the field.

While doing all this, we use various technological infrastructures and ensure that the process moves faster. Our infrastructure enables team communication, to-do list management and alarm system control from a single platform. This gives us ease of operation.

We add the alarms we need to our remote monitoring system and provide instant notification of the alarm to the phone.

We keep the most up-to-date version of all documentation of the power plant in our own cloud infrastructure and prevent document overcrowding. In this way, we ensure that the current versions of the files are kept organized in a single file.

Every evening, after you have finished your day’s work, we send an e-mail to your cell phone with the electricity generation graphs of your power plants. This email provides you with an end-of-day overview of your entire portfolio.

In short; we make your time more valuable and carry out your business processes as your engineering team. For detailed information, you can send an e-mail to [email protected].

We wish you sunny days.

How should precise PR calculation and PR verification work?

Calculation of PR in solar power plants and verification of the calculated PR value are among the services we offer the most today. Although a detailed methodology is given in IEC61724-1 on the calculation of PR, it is generally calculated as “Realized Production” / “Expected Production”. As a result of this calculation, we come up with a PR rate and we use this as a basis, but actually calculating PR “correctly” is a much more painstaking process.

First of all, it is preferable to calculate PR on an hourly rather than daily basis, and even more than hourly, on a minute-by-minute basis.

Let us now recall the formulation of PR as specified in the standard.

Here we determine the unit time. We can calculate PR for a day as a daily total or as a sum of hours. Have you ever wondered how PR changes/should change throughout the day?

For example, let’s calculate the PR of a facility on a daily basis for the past 7 days.

As you can see, it oscillates between 88% and 92% every day. Now let’s take it one step further and calculate it hourly.

Look how PR changes hourly. According to the formulation in the IEC standard, our PR increases in the morning and in the afternoon when it gets cooler. Now let’s take it one step further and calculate 5 minutes.

How does our PR oscillate when it becomes minute. But there are cases where the PR goes over 100% for a second, how does it happen? There are two PR calculation methodologies in IEC61724-1; the first is the PR calculation that does not take into account the panel temperature that I calculated above. Now let’s integrate the panel temperatures into the system and calculate the minutes. Let us first recall the formulation by which we calculated the regulation by temperature.

Now let’s calculate our temperature corrected PR value according to this formulation.

If you notice, there is no PR calculation above 100% and the PR value is now more stable throughout the day. We are now calculating PR with minute precision, but does the process end here? No, no, no.

This is the actual PR of the system we calculate. In fact, if there is a problem in the system, this PR may not be 84% but 82% (82% according to whom?) and we cannot catch it. Now we simulate this realized PR value again according to the actual irradiance/temperature values of the facility and compare the resulting PR values.

There have been some power outages / shutdowns in this plant, but there is no problem in the general behavior of the plant. The PR value we calculated above is very close to the actual PR value of the plant. At this stage, we can say that there is no problem in the facility.

Is PR alone a sufficient metric? No, it is not. As Solarian, we detail our calculations in the facilities we monitor and manage, from the effects of shadow losses in the winter months to the changing efficiency of inverters, so that we can reach clearer; error-free results. PR is just one of many variables for us.

If the health and production performance of your plant is important to you and you suspect that your plant is not producing enough, contact us.

Email : [email protected]

Effect of Dusting on Production in Solar Panels

“Soiling” is another issue that should be taken into account when calculating the production of solar power plants. Soiling is based on the effect of meteorological effects such as dusting and snowing on production. We calculate the soiling effect on the panels where we carry out production studies and include it in the production analysis. In this context, we examined the effect of dusting in two different provinces of Turkey far from each other. How much power loss due to dusting? Is washing really necessary? Let us examine it.

First, let’s look at the results of the test we conducted at our first plant.

The solar panels were very dusty. We first measured the solar panel when it was dirty, then when it was clean. So what did our measurement results tell us?

In this graph, the blue line is the IV graph of the solar panel (given in the datasheet). The green line is the measurement with dust and the red line is the measurement after the dust has been removed. The current section (Y-axis) is the part of the solar panel where problems such as degradation or dusting are reflected. The solar panel is not producing the power it should, so how much is this loss? Let us examine it.

In the first measurement we made on the solar panel, which should have a power of 370W, we detected a power around 343W. When we cleaned it later, we observed that this power increased to 349W. The difference between dirty and clean is 1.65%. This is a cleaner facility that receives relatively more rain. But how much impact will it have in a dirtier plant? Now let’s go about 700 kilometers south from the first site.

Here the turquoise line is the power of the panel, again based on the data in the datasheet. The orange color is dusty and the pink color is after cleaning. There is also a diode problem / microcrack in the solar panel here (pay attention to the breakage in the graph), but that is not our topic. So what is our numerical data?

Here, when we look at before and after pollination, we see a loss of approximately 3.14%. If this pollination continues until the end of the year, our annual production will drop by 3.14%.

It is not correct to say that the annual impact of dusting will be 3.14% directly. When it rains, the dust is washed away (sometimes it can sediment, but most of the time it is cleaned) or factors that damage the panel, such as bird droppings, may remain. Therefore, this value will change. Here we have not examined a SPP next to a facility that regularly generates dust, such as a cement plant/quarry. If you are near a facility that regularly generates dust, this figure is likely to be slightly higher.

In Turkey, a 1MWp ges plant generates between ~1,500MWh and ~1,600MWh per year. According to the distribution fee (before and after 2018), it generates an annual income between approximately 160.00USD and 200.000USD.

For an investor with a 1.65% annual dusting loss, the loss would be between 2,500USD – 3,000USD, while for an investor with a 3.14% dusting loss it would be between 5,000USD – 6,200USD. Solar panels shed some dust with every rain, but dust can also settle in some spots. Probably the annual average of these values will be lower than what we have calculated, but an investor with a 1MW ges can expect an annual income loss between 2.500USD – 5.000USD due to dusting.

In my opinion, the main point of washing the solar panels is to extend the life of the panels by cleaning the parts that can create hot-spots such as bird droppings on them, since only dusting does not damage your panels.

The danger of the washing process is panel breakage. In flat areas, cleaning can generally be done without breaking the solar panel, while in sloping areas, some machines can break the panel or washing machines can damage the panel surface. When the panel breaks, the whole advantage of this work is gone.

People who want to benefit from this service should examine the cost and production increase of the washing process and the risks such as the risk of breaking the panels or damaging their surfaces. Be sure to pay attention to whether the equipment used by the company you will have your solar panels washed has a certification and whether the cleaning material (detergent, etc.) to be used is suitable for this job. You don’t want to make too many eyes.

If we mention the deficiencies in the facilities we inspected in order of importance, 1) Monitoring system, 2) Cleaning of plants and 3) We can list it as dusting. If you pay attention to these issues, your facility will last longer.

Email : [email protected]

Solarian 2019 Semester 1 Evaluation

Hello friends,

You can watch our Solarian 2019 first half evaluation video below.

Status of Solar Roofs According to the New Regulation

You can access Onur Güneş’s article titled “The Status of Solar Roofs According to the New Regulation” here.

PR (Performance Ratio) calculation in solar power plants

One of Solarian’s new scopes of work is to regularly perform employer auditing services on behalf of the investor at operating power plants. In this context, it is in contact with the O&M contractor and ensures the follow-up and reporting of processes such as whether the contract terms are complied with, whether there is an interruption in the power plants. In a way, it takes the operational burden of SPPs from the investor.

As such, there is a need to calculate a metric that will clarify the issues between the investor and the O&M service provider. As you all guessed, this metric is the PR ratio calculation. So how should this PR ratio be calculated correctly? How successful is the PR ratio in the operation of a facility? Is the PR rate sufficient for everyday use?

The PR ratio is simply the ratio of actual production to calculated (expected) production.

Actual production is the value we should get from the OSOS counter. So how should “Expected Production” be calculated? It is better understood if I show the calculation on the PVSYST example.

The part I have marked in red here is the measurement value we get from the pyranometer or reference cell. It means that we aim for 1.915 kWh/m² of radiation in a year. 51.527m² is our panel surface exposed to sunlight. Based on the fact that our solar panel is produced with 16.12% efficiency, we find that we have an installed DC power of 51.527m² * 16.12% = 8.306kWp.

1.915 kWh/m² * 51.527m² * 16,12% = 1.915 kWh/m² * 8.306kWp = 15.910MWh expected production. If we put this into our formula

The PR ratios we will obtain as a result of this calculation will change according to the months due to temperature and according to the years due to degradation. If we calculate the yearly PR distribution for the PVSYST operation that I shared the example above, we will see a graph like below (In the PVSYST production report above, temperature and degradation are taken into account. In the graph below, he did not participate).

The value that PVSYST gives us for this study is 81.5%. So why are we not in the 100%-95% band? First of all, there are some calculated losses within the system itself. In the PVSYST report, when you look at the route from 15,910MWh to 13,565MWh, you will see that there are losses within the system itself.

In IEC 61724-1, the PR calculation is calculated as follows, taking into account the temperature.

You didn’t understand anything, did you? 🙂 Don’t worry, the number of people who understand is very few 🙂 In summary, in the calculation I gave above, DC calculates the installed power by revising it again with the average temperature in each unit calculation period (hourly, monthly, yearly, etc.). The goal here is to get rid of the PR value that changes every month and to reach a constant value in all months, thus making it easier to track.

But is PR really the right metric to monitor a facility? Let’s share a screen from the PR calculation page of a Turkish monitoring company. This company’s PR calculation model works as follows.

Let’s look at a PR calculation based on this calculation

Here, two plants are in the same place and have the same power. Even the whole design is the same. No shading, no land slope. So why are the PRs different? Many factors can affect this figure, such as temperature, wind, quality of the panels, etc.

But there is another issue to be considered here, and a very important one. People perceive that this band is normal when they see a value in the 75%-85% band and after a while, if the PR value is not close to 50%, they think that the plant is working properly.

That’s why I’ve never really believed that PR is a quality metric – easy to write into a contract, but ineffective for site management. How?

Let’s say there are 20 inverters in our facility. Let’s assume that one inverter is disabled; the effect on PR will be x(1/20). For example, if we disable one inverter for the facility with 81.6% PR above, 81.6% * (1-1/20) = 77.5%. Look, the number is very close to the PR of the other facility.

Now let’s modify the graph above so that an inverter is disabled.

What would you think? For example, when I first saw them, they were both in the 77-79% range and I thought there must be no problem. For many people who watch their facilities in this way, PR is a calculation freak that makes no sense to me.

As Solarian, we definitely do not hide behind PR in the facilities we monitor and manage. In the analytical infrastructure we have developed, many variables from DC input arms of the plants to inverter parameters are monitored and reported live. Thus, a real plant efficiency can be observed. If you want to manage your facility in a healthy way, don’t get stuck on PR figures. Let our team and infrastructure take over that task for you.

Email : [email protected]

  • Page 1
  • Page 2
  • Page 3
  • Interim pages omitted …
  • Page 9
  • Go to Next Page »

SOLARIAN